Supporting Fishery Decision Making
Visualizing and communicating MSE results

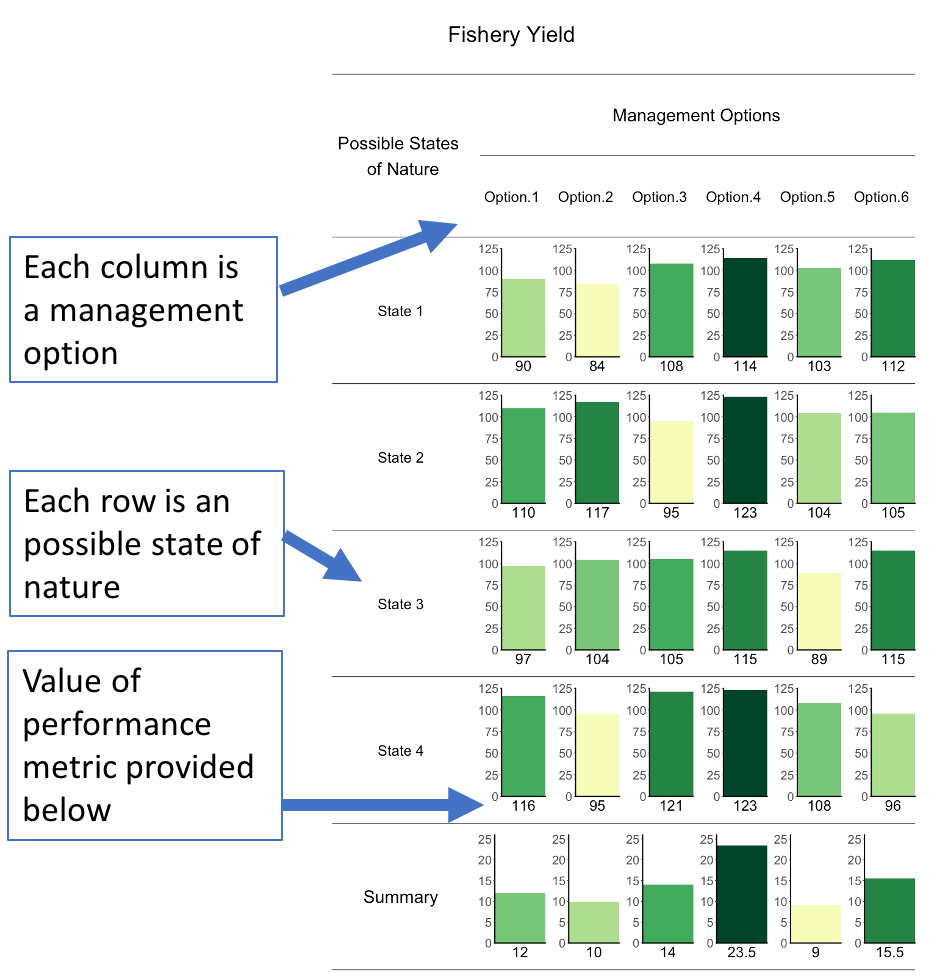
A key strength of Management Strategy Evaluation (MSE) is its ability to help assess trade-offs between diverse and potentially conflicting management goals. However, as the number of goals considered increases, the volume of additional quantitative output can be challenging to present in a manner that is easily interpreted by end users. This study provides a decision table visualization tool to highlight trade-offs and draws on applied examples from the recent Atlantic herring MSE conducted by the New England Fishery Management Council to demonstrate its contribution to a real-world fishery decision-making processes.